What is Firebase Analytics? How can you use it? Your search ends here.
As an app developer, if you don’t measure your app activities, you’ll regret ’em sooner or later.
Why?
It’s like someone starts stealing your shoes, and ends up stealing your whole property, but you have no idea how did it happen?
It’s where analytics comes in handy.
Imagine you install Firebase Analytics at your home (in this case your app), if something goes missing, you could get an alert. 😀
You may call it Google Analytics for Firebase developers or Google Analytics 360 that is an extremely expensive product.
How great? Right.
Firebase Analytics helps to make your app better for end-users, happy users can boost your ranking on Google Play Store, remember the ASO science?
In simple words, Firebase Analytics helps your mobile apps to measure in-app behavior that includes:
- Who your users are
- Which feature they’re using the most
- How much you’ve earned
Much more.
Quick Jumps
What is Firebase Analytics (Skip If You Already Know)
Firebase Analytics is a Google-owned tool that attempts to analyze your app behavior so that you can make timely decisions and can grow your app to the next level.
As you already know the market is full of analytics tools, but Google creates the best since it has the sole purpose of collecting data to earn money.
As it’s developed by Google, the Big G has provided everything a developer needs to know and the practices that can help him to make a better app.
And it provides you free and unlimited logging and reporting.
That’s right you read this right. No quotas, No sampling, No paid tiers to worry about.
How does it start?
Simply Installing the Firebase SDK to your app and Analytics starts providing insight into your app (explained later on in the article)
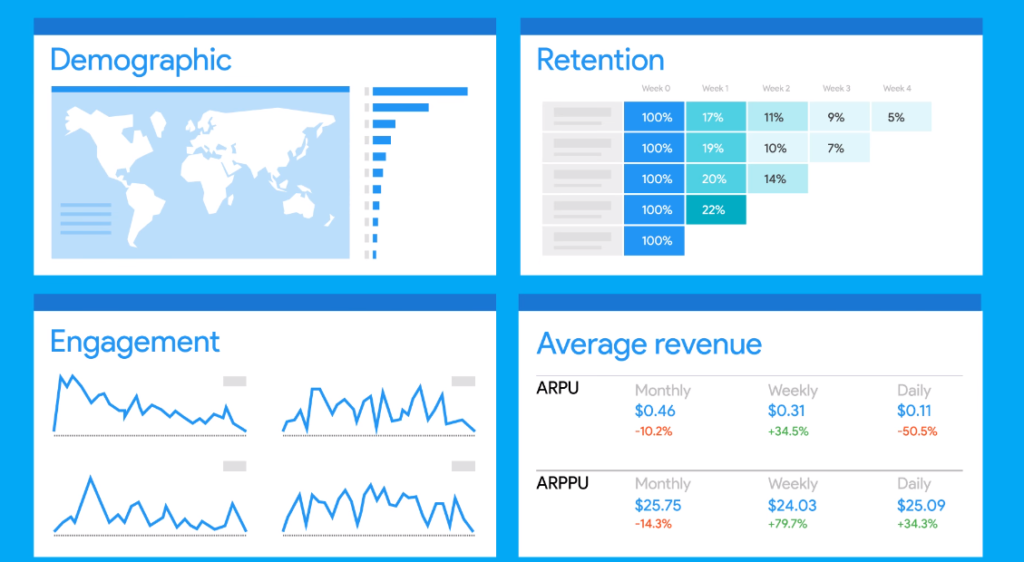
Moreover, you get:
- Demographic: The locations they visit, age and gender.
- Retention: How regularly they use your app
- Engagement: How much time users spent on your app
- Average Revenue: How much they spent on your app
Furthermore, you can also get detailed information about what your users are up to by logging events specific to your app.
The events-based data can be anything from adding an item to the cart.
The best part?
You can create your own custom event as a user completed a workout in your fitness app.
So in addition to demographic information, you can discover how your users behave differently by using custom user’s properties.
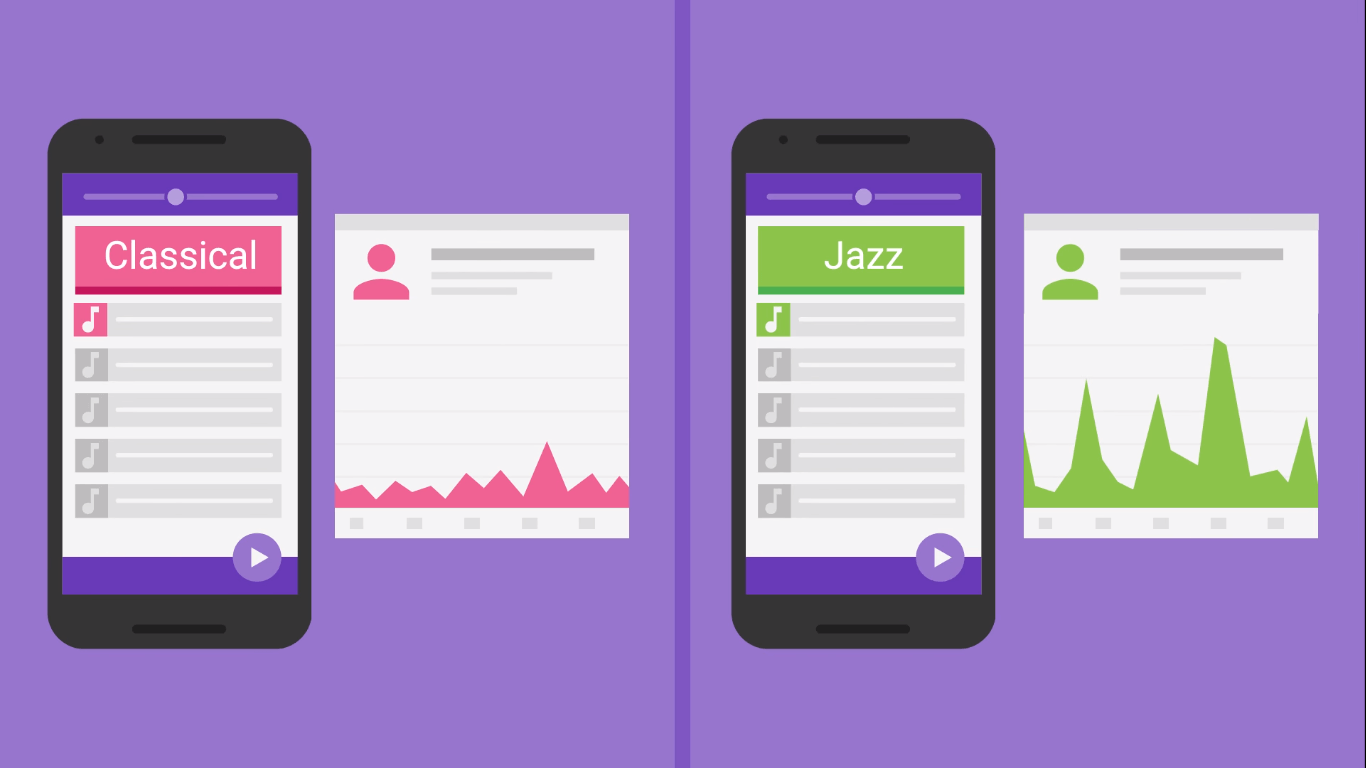
For example:
You have a music app and you want to find out that your classical music fans are browsing more albums than your jazz fusion fans.
You can easily get that type of data using the custom user’s properties.
Besides Firebase Analytics doesn’t just measure, but also shows what’s happening inside your app.
It lets you combine your behavioral reporting. It means to know about your users what are doing with attribution reporting and which growth campaign is bringing people to your app in the first place.
I know what you’re thinking; you can also use Firebase Crashlytics? Isn’t it? Read that article to know how to use it. 😀
So if you want to know which ad campaign is bringing users who spent the most money.
Or sharing the app with their friends.
And users have completed the last level of your game and are waiting for the next sequel.
You can do all that stuff with Firebase analytics.
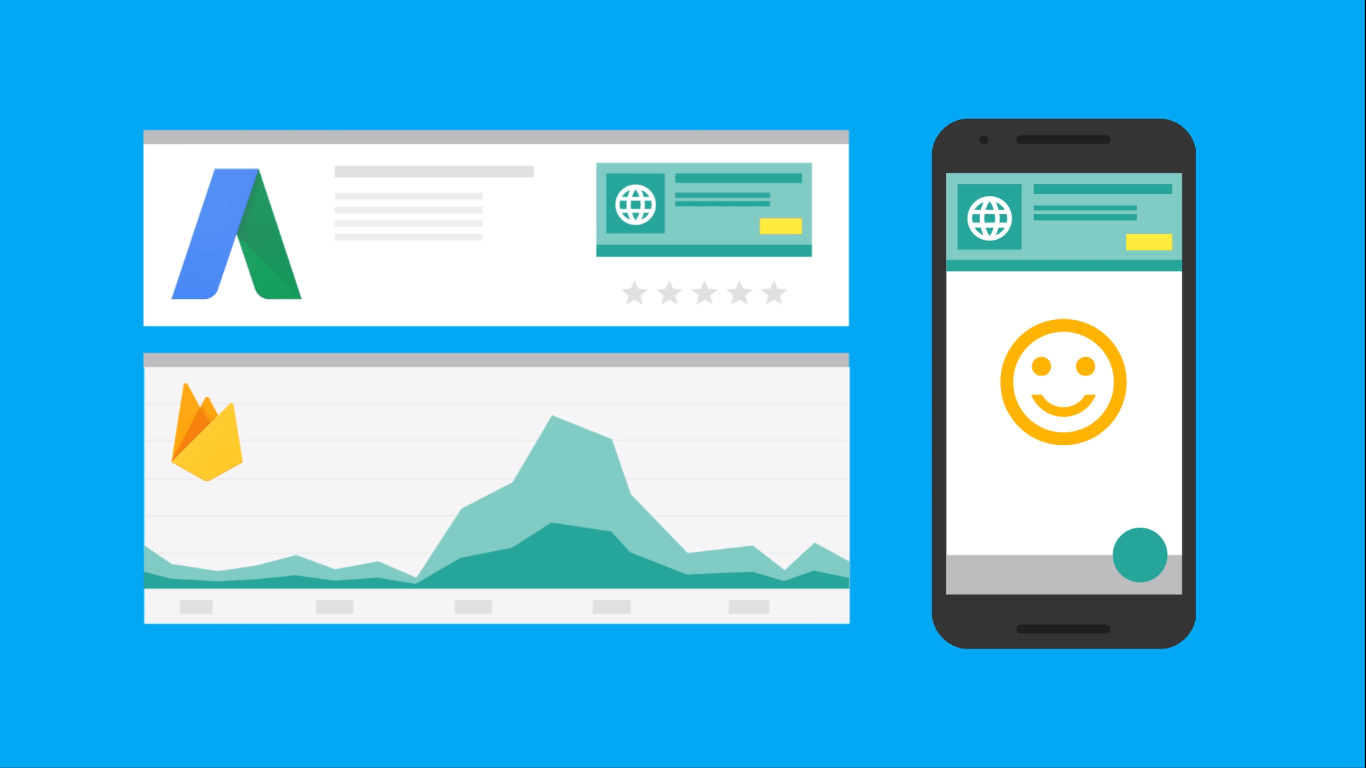
One of the great features of Firebase analytics is to give you the power to build up a group of users, audiences.
For instance, do you want to target the users in the USA who have visited the garments section of your in-app store?
It’s easy.
Just a few clicks on Firebase Console.
Once your app built the audience, you can send notification using Firebase notification
And you can modify their in-app experience using Firebase remote config.
As well as you can target them through Google Ads.
It is not only limited to it, but Firebase features are extremely helpful to developers.
So you can get the impact that you measure using analytics, you can confirm you’re getting the outcome you expect.
Additionally, you can export all your data collection in Google BigQuery where you can run super-fast SQL queries to hope down the data however you like.
Likewise, you can even combine other analytics data that you might be capturing.
How to Use Firebase Analytics
In this portion, we are going to integrate analytics into your app.
1. Create/Open Android Studio Project
- First of all, create a new Android Studio project or open your existing project.
2. Integrate a Firebase Project
- Click on Tools -> Firebase that is available on the top navbar.
- Now Firebase assistant is open on the right side of the Android Studio.
- Next, click on analytics -> log on analytics events.
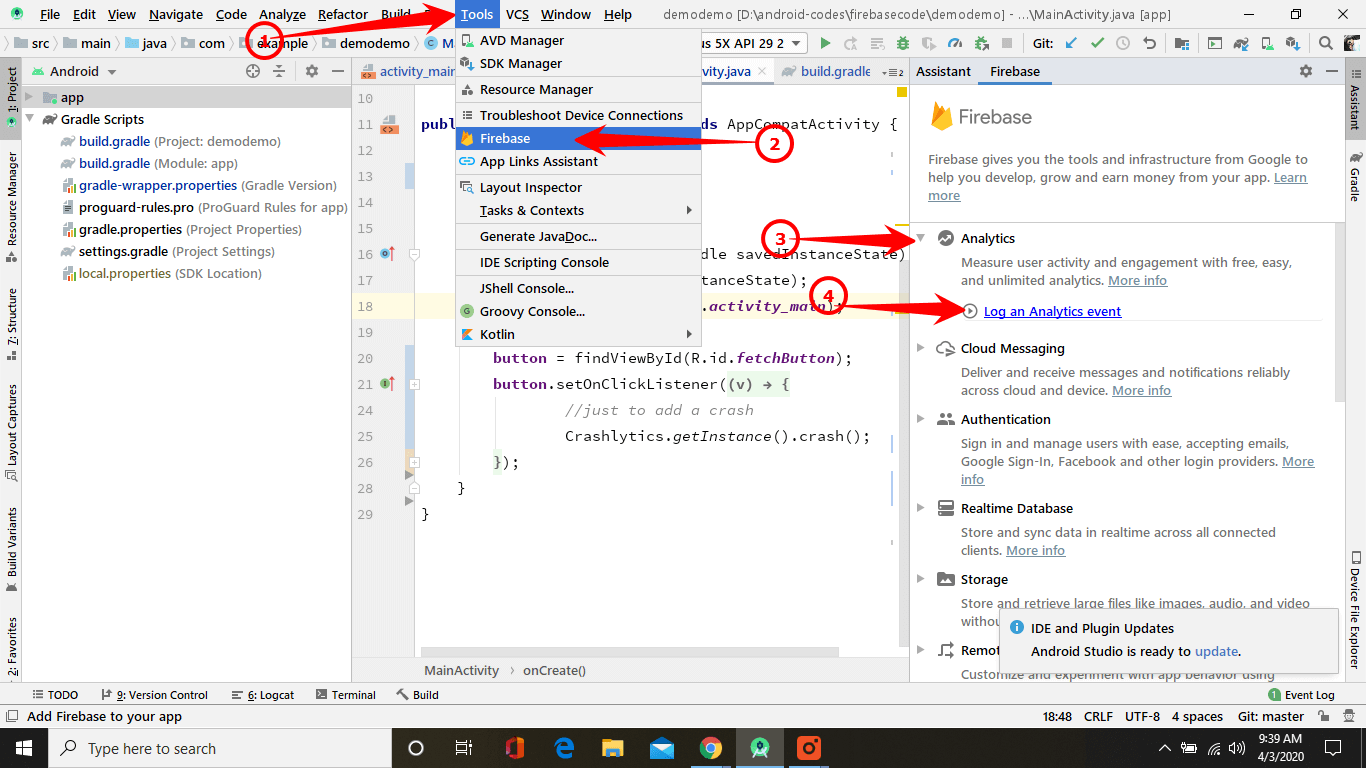
- Now click on Connect to Firebase.
- It’ll open a popup box, you can create a new project or you can open your existing project. It is as easy as you drink a cup of coffee then click “Connect to Firebase”.
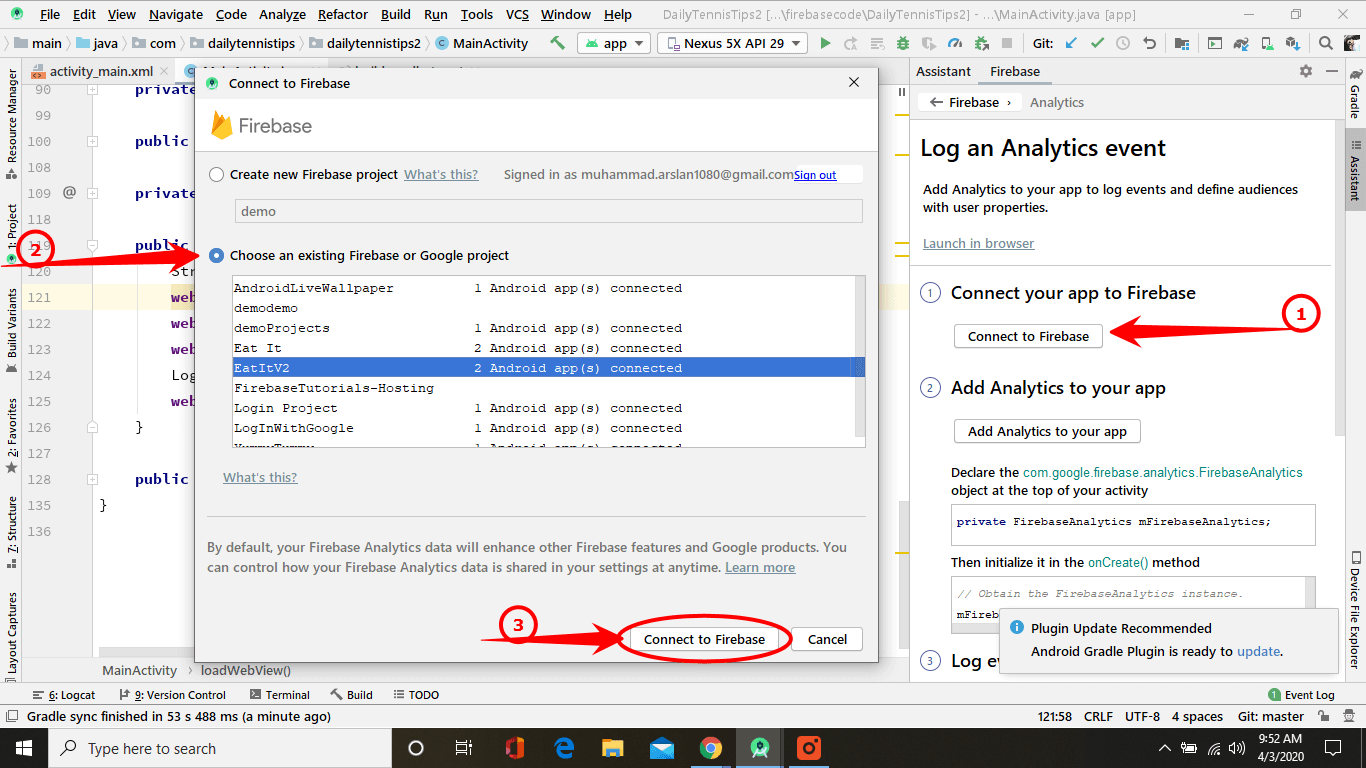
- When your app is connected, click on “add analytics to your app“.
- Now in order to add dependencies to your app click “Apply changes“.
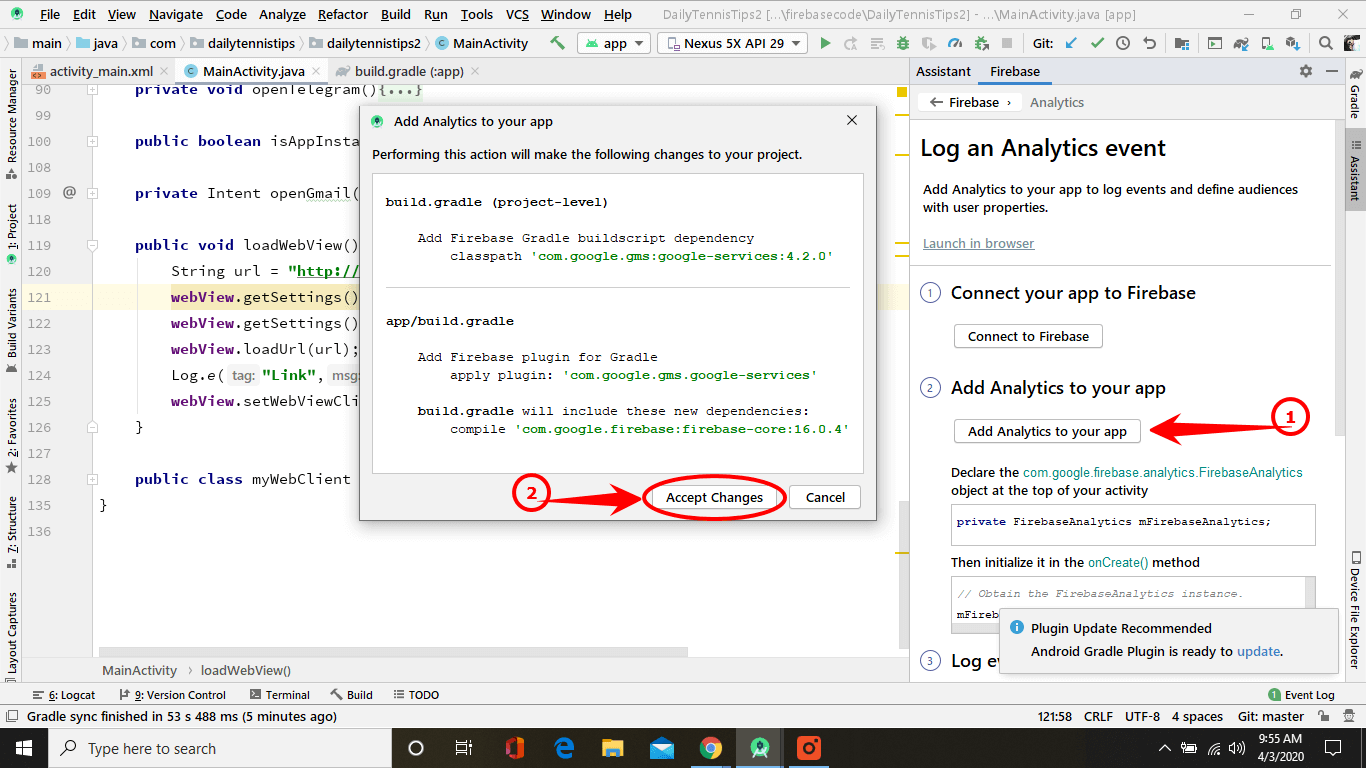
- Next, go to build.Gradle(app level) file and add below code inside dependencies{ } block and click sync now.
Now your app is connected with Firebase and analytics is configured successfully.
Note: Always try to upload the latest dependency.
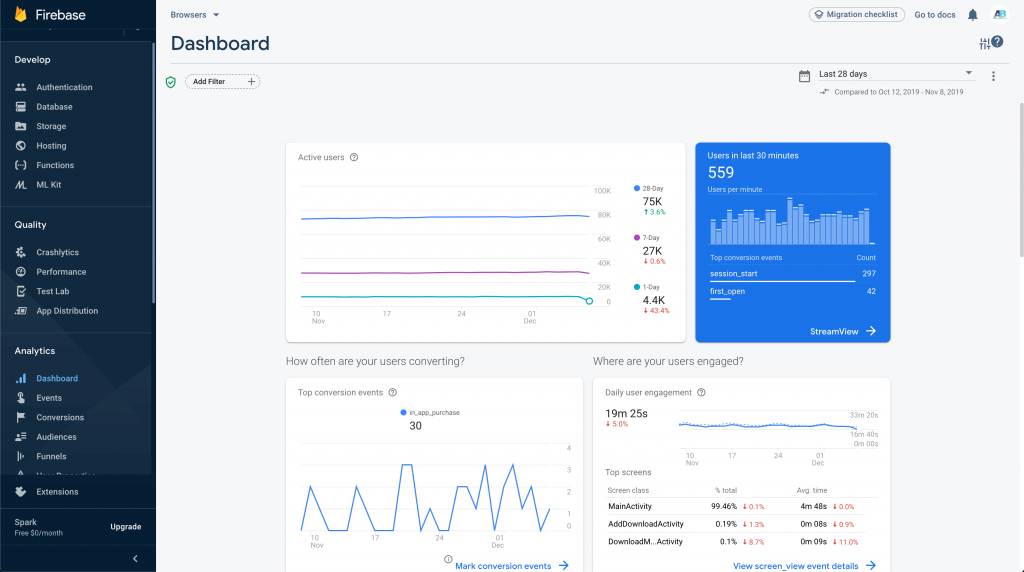
Understand the Firebase Analytics Dashboard
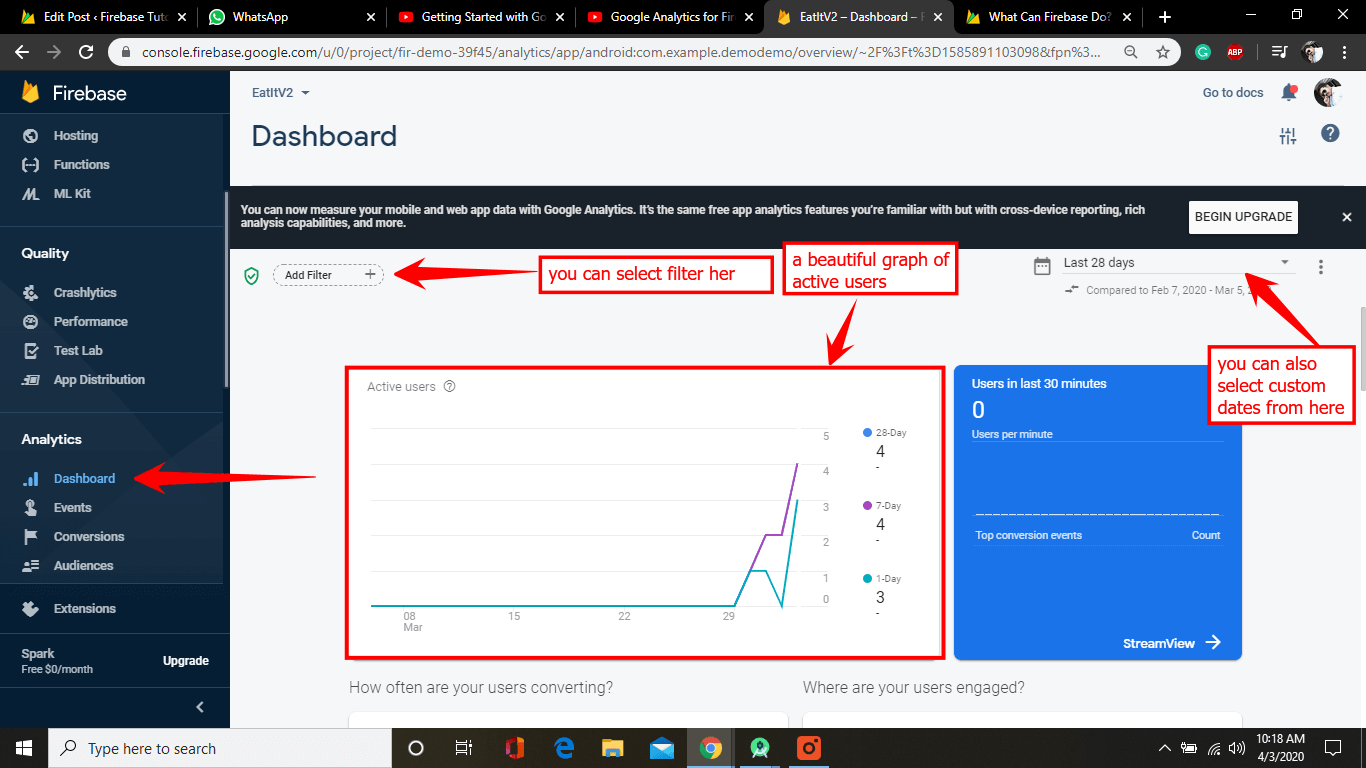
- Now go to the Console and open your Firebase Project.
- Click on Analytics Dashboard that is available on the left side in the navbar.
With the help of the Firebase Analytics Dashboard, you can get a number of events to gain more insights.
You can see a short introduction of the features down here:
- Filter: You can apply the filter on a specific app, specific platform, audience type(purchase or free), age, etc.
- Date: You can view data according to the date like daily, weekly, monthly or any other specific day.
- Active users: You can check information regarding users like when they are online, etc.
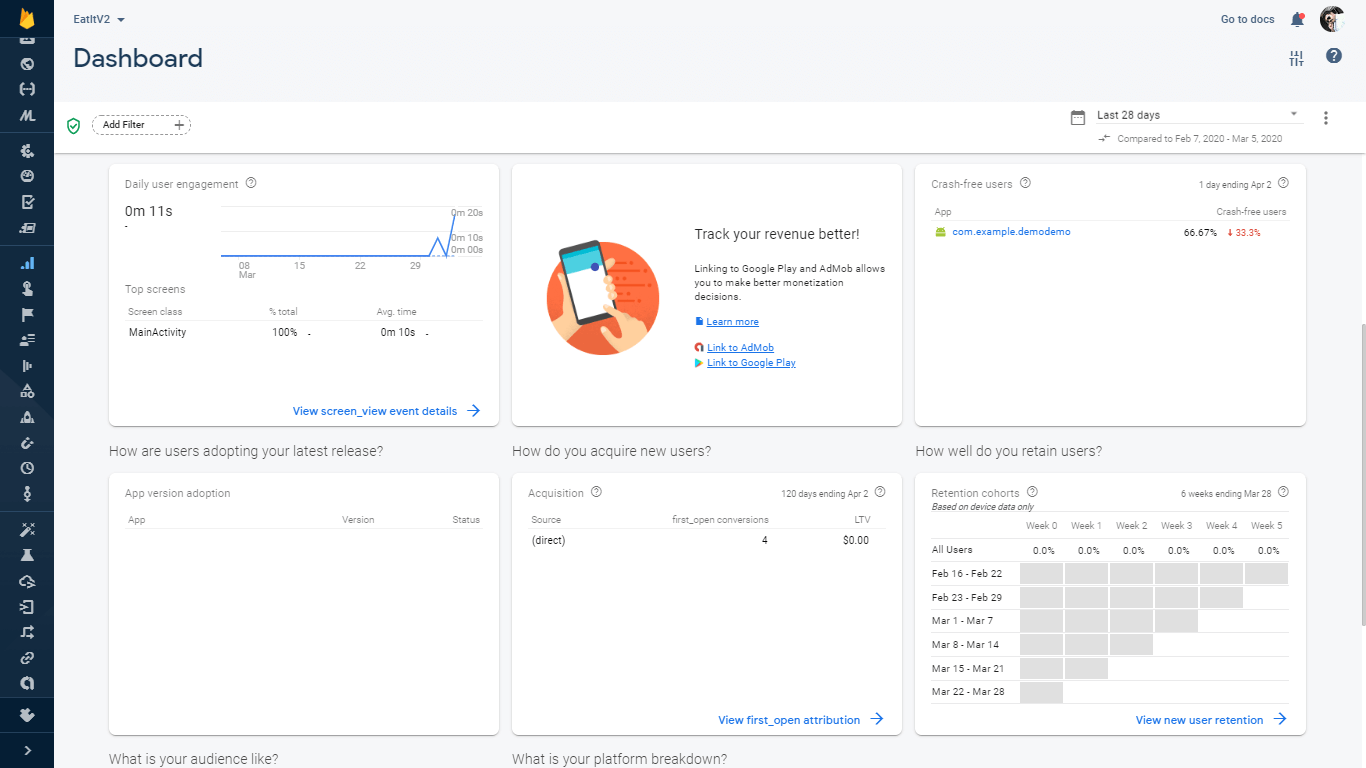
- Daily user Engagement: You can see how much user spend time(screen time) with your app
- Revenue tracking: You can track your revenue information here.
- Crash free users: You can check the stability of your app here. You can check when the app crashes on users’ devices.
- Latest Release: When you upload a new version of your app it is very important to check if your new version is stable or not? People adopting this change or not? You can find these answers here.
- Acquisition: If you are working on a marketing type campaign then this helps you very much. You can analyze how many users you acquire etc.
- Retention rate: You have a retention rate card available in the dashboard. It lets you check how well your users are performing on your app.
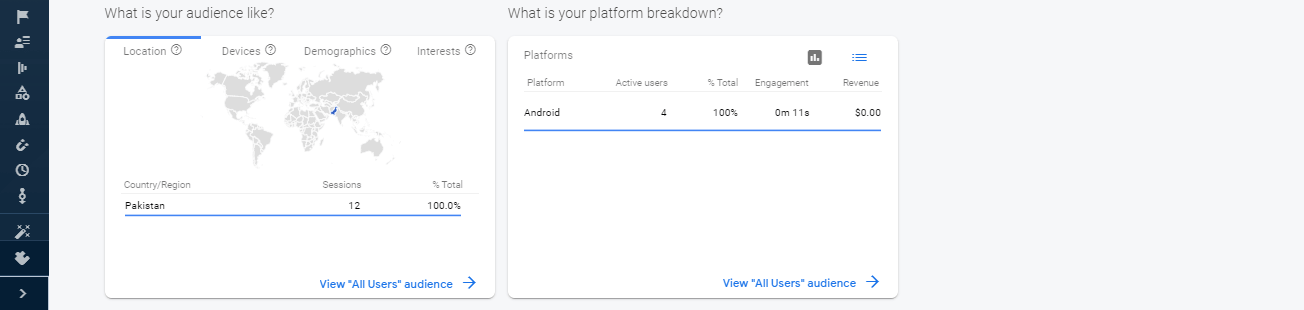
- Audience: It will tell you information regarding location, interest, devices, demographics, etc.
- Platform breakdown: It will tell you all basic and important information regarding all platforms (web, android, ios) like their active users, engagement, revenue, etc.
Now it’s your turn. Give us a tip we didn’t know or ask a question you always wanted to ask from an Android expert.
3 thoughts on “What is Firebase Analytics and How to Use It? (Guide)”
Comments are closed.